
Section 1 - Overview of the Philippines
1.1 Socio-Economic Situation
Philippines is an archipelagic country composed of 7,107 islands with a combined land area of 32,489,480.79 hectares. It consists of 17 regions, 81 provinces, 136 cities, 1,495 municipalities and 41,995 barangays (village, the smallest political unit) as of September 2008. Total population stood at 88.575 million as of 2007 census with average annual growth rate of 2.04% during the census period 2000-2007. The 17 regions are grouped into 4 major geographic areas, namely:
- National Capital Region (NCR): comprising of entire Metro Manila
- Luzon: comprising of Regions 1-5 + CAR
- Visayas: comprising of Regions 6-8
- Mindanao: comprising of Regions 9-13 + ARMM
Based on 2007 census, NCR has a total population of 11.6 million which accounts for 13.0% of the national population. Luzon has the highest population of 38.2 million or 43.2% of the total while Visayas has 17.2 million or 19.4%. Mindanao posted population of 21.6 million, equivalent to 24.3% of the national total. Details are presented in Figure 1.1.
Figure 1.1: Distribution of Population by Geographic Group (in %)
The government is estimating around 8.4 million Filipinos (all ages) with various types of disabilities as of 2005, which is consistent with international trend of about 10% of the country's population. Based on the Philippine Registry for Persons with Disabilities conducted by the Dept. of Health in 2005 wherein a total of 508,270 persons with disabilities were registered, a little more than half (54.6%) of persons with disabilities are male. Orthopedic top the list of disabilities with 25.7% share followed by communications (17.3%), visual (16.2%), multiple (11.8%), mental (10.2%), chronic illness (9.9%), psychosocial (6.5%), and learning (2.5%). Note, however, that there is a lingering issue on the classification of disabilities used by different government agencies involved in various concerns for persons with disabilities which could partly be attributed to the catch-all definition of persons with disabilities in the Magna Carta for Disabled Persons (RA 7277).
| Area | 2007 (Aug 1) | 2000 (May 1) | 1995 (Sep 1) | 1990 (May 1) |
|---|---|---|---|---|
| Philippines | 88,574,614 | 76,504,077 | 68,616,536 | 60,703,206 |
| National Capital Region | 11,553,427 | 9,932,560 | 9,454,040 | 7,948,392 |
| Cordillera Administrative Region | 1,520,743 | 1,365,412 | 1,254,838 | 1,146,191 |
| Ilocos Region | 4,545,906 | 4,200,478 | 3,803,890 | 3,550,642 |
| Cagayan Valley | 3,051,4876 | 2,813,159 | 2,536,035 | 2,340,545 |
| Central Luzon | 9,720,982 | 8,030,945 | 6,932,570 | 6,199,017 |
| Southern Tagalog | - | - | - | 8,263,099 |
| IV-A- Calabarzon | 11,743,110 | 9,339,618 | 7,750,204 | |
| IV-B - Mimaropa | 2,559,791 | 2,299,229 | 2,033,271 | |
| Bicol Region | 5,109,798 | 4,686,669 | 4,325,307 | 3,910,001 |
| Western Visayas | 6,843,643 | 6,211,038 | 5,776,938 | 5,393,333 |
| Central Visayas | 6,398,628 | 5,706,953 | 5,014,588 | 4,594,124 |
| Eastern Visayas | 3,912,936 | 3,610,355 | 3,366,917 | 3,054,490 |
| Western Mindanao | 3,230,094 | 2,831,342 | 2,567,651 | 2,459,690 |
| Northern Mindanao | 3,952,437 | 3,505,708 | 3,197,059 | 2,197,554 |
| Southern Mindanao | 4,156,653 | 3,676,163 | 3,288,824 | 4,006,731 |
| Central Mindanao | 3,829,081 | 3,222,169 | 2,846,966 | 2,032,958 |
| ARMM | 4,120,795 | 2,803,045 | 2,362,300 | 1,836,930 |
| Caraga3 | 2,293,480 | 2,095,367 | 1,942,687 | 1,764,297 |
| Filipinos in Philippine Embassies/Consulates and Missions Abroad | 2,279 | 2,851 | 2,830 | 5,212 |
- Note #2
- Source: National Statistics Office.
- Return
- Note #3
- Caraga became a region under RA No. 7901 dated February 23, 1995, created from Regions 10 and 11.
- Return
Note: In 2000, the population of disputed areas was reported in the next higher geographic level. For example, the population of province A claimed both Province A and B will be reflected in the region, but not in Province A nor Province B. This explains the discrepancy when one sums up the province details which is less than the regional totals.
Based on the annual per capita poverty threshold income of P15,057 (roughly US$376.4 based on P40:$1 exchange rate) almost 27% of Filipinos or 4.7 million belong to poor families in 2006. The incidence of poverty per area is presented in Table 1.2 while the summary is as follows:
Incidence of Poverty in the Philippines
| Region / Province | Estimates of Poverty Incidence Among Families (%) | Estimates of Magnitude of Poor Families | ||||
|---|---|---|---|---|---|---|
| 2000 | 2003 | 2006 | 2000 | 2003 | 2006 | |
| Philippines | 27.5 | 24.4 | 26.9 | 4,146,663 | 4,022,695 | 4,677,305 |
| National Captial Region | 5.8 | 4.8 | 7.1 | 127,655 | 110,864 | 167,316 |
| Region I (Ilocos Region) | 29.5 | 24.4 | 26.2 | 237,910 | 213,846 | 248,443 |
| Region II (Cagayan Valley) | 25.3 | 19.3 | 20.5 | 143,421 | 113,298 | 126,726 |
| Region III (Central Luzon) | 17.3 | 13.4 | 16.8 | 268,558 | 242,820 | 320,109 |
| Region IV-A (Calabarzon) | 15.2 | 14.5 | 16.7 | 272,484 | 316,911 | 374,952 |
| Region IV-B (Mimaropa) | 36.4 | 39.9 | 43.7 | 162,668 | 199,485 | 238,489 |
| Region V (Bicol Region) | 45.3 | 40.6 | 41.8 | 407,176 | 383,625 | 422,278 |
| Region VI (Western Visayas) | 36.7 | 31.4 | 31.1 | 444,172 | 397,073 | 425,571 |
| Region VII (Central Visayas) | 31.5 | 23.6 | 30.3 | 348,154 | 286,478 | 391,484 |
| Region VIII (Eastern Visayas) | 37.6 | 35.3 | 40.7 | 276,878 | 266,423 | 331,426 |
| Region IX-B (Zamboanga Peninsula) | 38.6 | 44.0 | 40.2 | 209,842 | 258,497 | 250,696 |
| Region X (Northern Mindanao) | 38.0 | 37.7 | 36.1 | 261,501 | 278,538 | 285,054 |
| Region XI (Davao Region) | 27.9 | 28.5 | 30.6 | 202,121 | 231,068 | 257,554 |
| Region XII (Soccksargen) | 40.7 | 32.1 | 33.8 | 264,301 | 227,093 | 253,009 |
| Cordillera Administrative Region | 30.8 | 25.8 | 28.8 | 84,717 | 72,084 | 87,050 |
| Autonomous Region in Muslim Mindanao | 53.8 | 45.4 | 55.3 | 255,879 | 228,970 | 295,220 |
| Region XIII (Caraga Region) | 43.8 | 47.1 | 45.5 | 179,226 | 195,622 | 201,929 |
- Notes
- Zamboanga Sibugay (Region IX) and Compostela Valley (Region XI) are new provinces created under EO 36 and EO 103.
- Isabela City (Region IX) and Cotabato City (Region XII) have been separated from their respective mother provinces - Basilan and Maguindanao (both ARMM) under the present regional configuration.
On the other hand, the country's state of human development (satisfaction of basic needs) improved in 2000 as exemplified by the increase of human development index (HDI) of 0.656 in 2000 from 0.629 in 1997. All component indices grew in 2000 but the most remarkable progress was noted in income index.
| Quality of Life Index | 2000 | 1997 | 1994 | Difference | |
|---|---|---|---|---|---|
| 2000-1997 | 1997-1994 | ||||
| Human Development Index | 0.656 | 0.629 | 0.627 | 0.027 | 0.002 |
| Life Expextancy Index | 0.752 | 0.717 | 0.707 | 0.015 | 0.010 |
| Education Index | 0.840 | 0.835 | 0.812 | 0.005 | 0.023 |
| Income Index | 0.394 | 0.336 | 0.361 | 0.058 | (0.025) |
Source: National Statistical Coordination Board
In the last 5 years, the economy of the Philippines behaves closely with election years. It jumps up during election years and mellows down afterward. Notice that the gross domestic product (GDP) (at constant 1985 prices) registered a growth rate of 6.4% in 2004, an election year. Expectedly, it went down to 4.9% in 2005 and crawled up a bit to 5.4% in 2006. It jumped up again to 7.2% in 2007, another election year. As expected, it nose dived in 2008 to 4.6% in first quarter and 4.57% in second quarter. It is projected to shoot up again in 2010 where national elections will be held. This is shown in Figure 1.2. Refer to Table 1.4 for details.
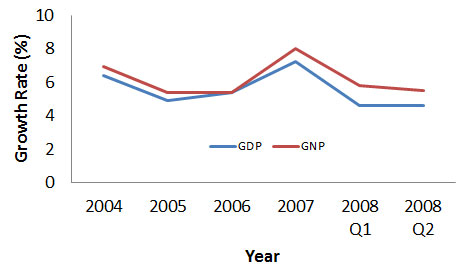
Figure 1.2: GDP and GNP Growth Rate (at constant 1985 prices)
Aside from the observed pattern of GDP growth rate, the national accounts show that all the major industries contributed to the growth of GDP in 2007. For instance, agriculture, fishery and forestry (AFF) sector registered a moderate expansion from 3.7 percent in 2006 to 4.9 percent in 2007. Industry sector rose faster at 7.1 percent in 2007 from 4.8 percent in 2006, while services grew at a healthy 8.1 percent in 2007 from 6.5 percent in the previous year. Robust performances were recorded in the mining and quarrying, construction, and finance subsectors.
| Year | At Current Prices | At Constant 1985 Prices | ||||
|---|---|---|---|---|---|---|
| Gross Domestic Product | Net Factor Income from Abroad | Gross National Product | Gross Domestic Product | Net Factor Income from Abroad | Gross National Product | |
| 2003 | 4,316,402 | 315,077 | 4,631,479 | 1,085,072 | 86,359 | 1,171,431 |
| 2004 | 4,871,555 | 376,509 | 5,248,064 | 1,154,295 | 98,036 | 1,252,331 |
| 2005 | 5,444,038 | 447,145 | 5,891,183 | 1,211,452 | 108,548 | 1,320,000 |
| 2006 | 6,032,835 | 500,940 | 6,533,775 | 1,276,873 | 115,132 | 1,392,005 |
| 2007 | 6,648,245 | 601,078 | 7,249,323 | 1,368,641 | 134,173 | 1,502,814 |
- Note 4
- All figures are estimates as of Aug 2008. Details may not add up to totals due to rounding.
- Return
Source: National Statistical Coordination Board (NSCB)
At regional level, 14 out of 17 regions posted significant growth in their regional gross domestic product (RGDP) in 2007. The top 5 are Region 4B, Region 7, Region 13, Region 10 and
Figure 1.3: Comparative Growth Rates of Regional Economies
On geographic grouping category,
Figure 1.4: Percentage Share to Total GDP by Major Island Group, 2005-2007 (at constant 1985 prices)
As can be seen from Table 1.4, the Philippines is benefiting from dollar remittances of its more or less 1.06 million (as of 2004) overseas Filipino workers (OFW). Cash remittances of OFW were estimated at P50.4 billion per year based on NSO survey in 2005. In fact, it is one of the saving graces of Philippine economy in times of economic crisis. Regions that are benefiting most from OFW cash remittances are
Figure 1.5: Cash Remittances by Region, 2003
The national government is projecting an annual OFW remittances inflow of $16-17 billion in both 2008 and 2009. This is despite the current global economic crisis, which resulted in job losses for a number of OFWs. Confidence in the resilient inflow of remittances is due to the surge of demand for more highly-skilled workers abroad that have bigger salaries. In the coming years, the performance of a lot of the country's industries will still be dictated by the health of these remittances. This is particularly true for the real estate, retail, and manufacturing sectors.
1.2 Political Situation
The Philippines is under a democratic form of government – as established by the 1987 Constitution - patterned from the USA. A president heads it. He is both the head of state and the head of government for a term of six years. As a multi-party system, the government has three branches: the executive, the legislative, and the judicial branch. The executive branch is the law-enforcing body and is headed by the President. The legislative branch is the law-making body, whereby its power is with the Senate and the House of Representatives. The judicial branch is the law-interpreting body and its power is with the courts, the highest of which is the Supreme Court. All these branches are independently monitored by the Ombudsman, which has the power to prosecute any official alleged of graft and corruption.
Furthermore, the country has local government units (LGUs) for provinces, which are divided into smaller units: cities, municipalities, and barangays. A governor heads a province; a mayor heads a city or a municipality; while a barangay captain heads a barangay. Every locally elected official is entitled to serve a term of three years.
For every aspect of the country's well-being, the government has agencies that are headed by Cabinet officials. Among these are the Department of Health (DoH), the Department of Education (DepEd), and the Department of Social Welfare and Development (DSWD) for the people's well-being; the Department of Public Works and Highways (DPWH) for infrastructure; the Department of Science and Technology (DoST) for the promotion of research and technological advancements; the Department of Trade and Industry (DTI) for enhancing business and job creation; etc.
Among other institutions in the country, the Roman Catholic Church is a strong political driving force. This has been shown in the People Power Revolutions of 1986 and 1998 in which the Marcos regime and the Estrada administration, respectively were overthrown. The former has been particularly important as it restored the means to balance the State's power - the Philippine Bill of Rights gives protections against government power. It includes the due process and equal protection clause, the right against unwarranted searches and seizures, the right to free speech, the free exercise of religion, the right against self-incrimination, and the right to habeas corpus.